Gigabytes of session logs that nobody reads
Claude Code writes every session to JSONL on disk. Mine grew to 2.4 GB. The built-in usage stats are totals, so when one run was slow or expensive, the reason sat somewhere in those files, unread.
One session, opened up
-
A1: Per-session tabs
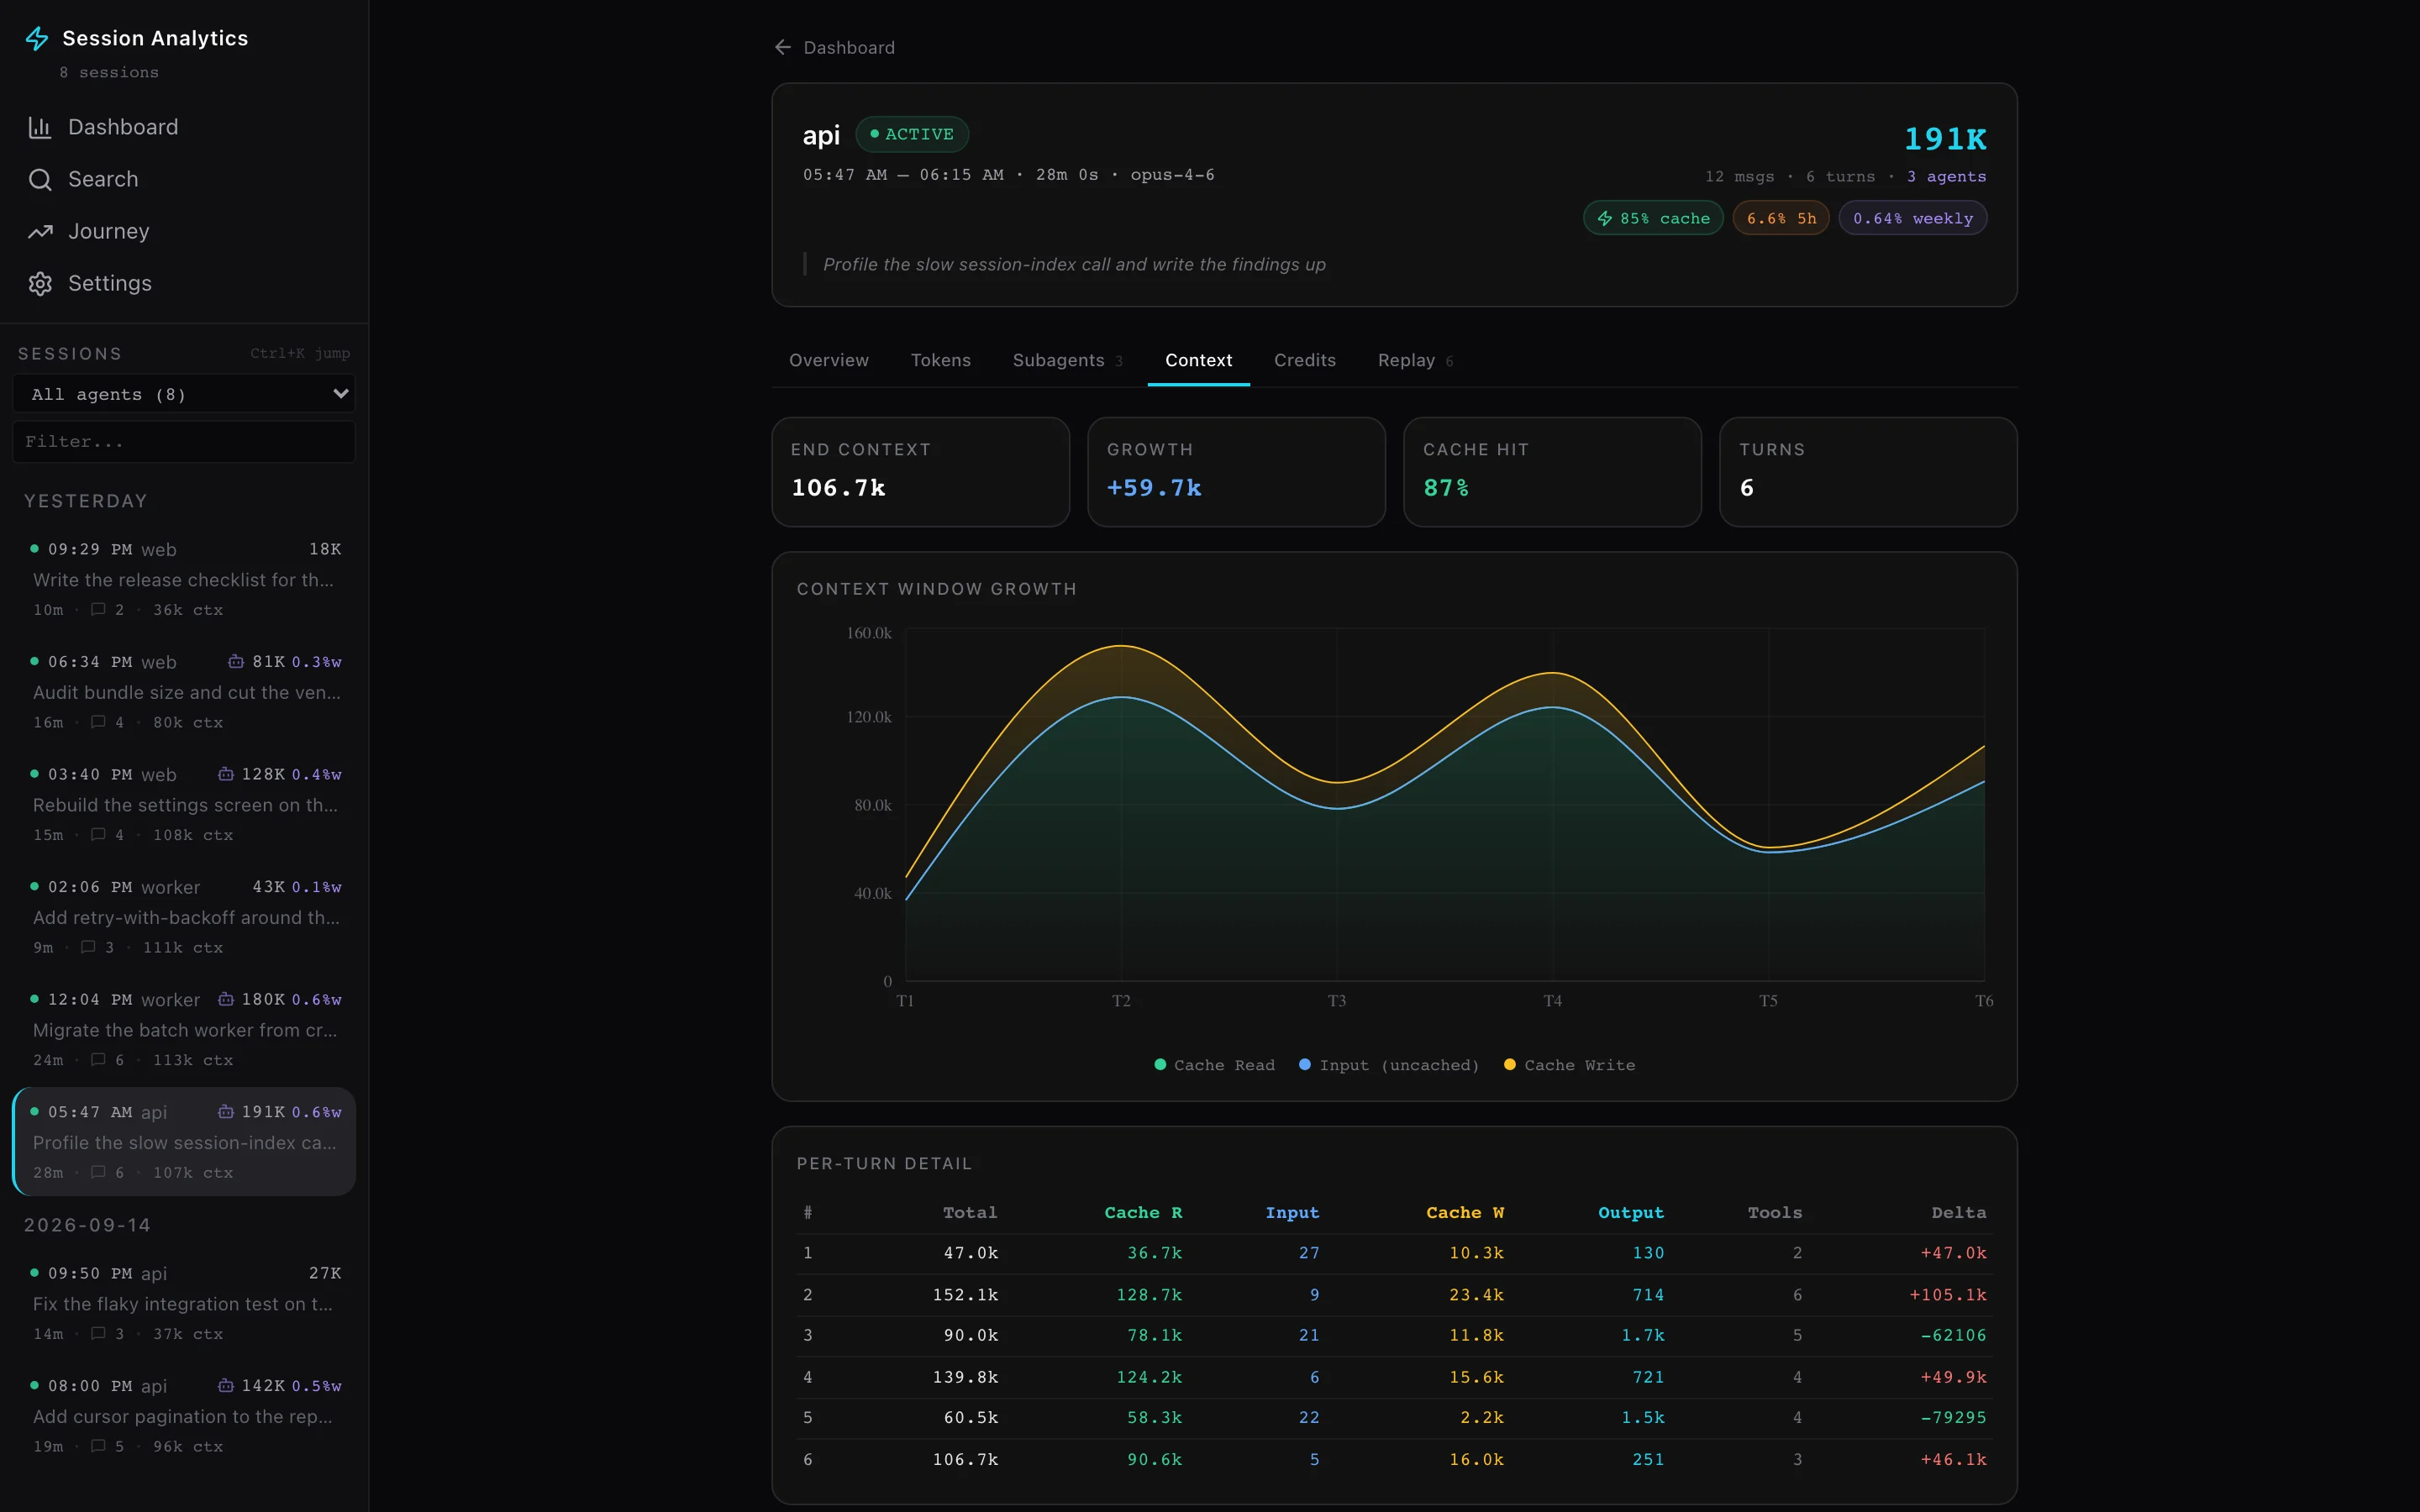
Overview, tokens and cache use, subagents, context-window growth turn by turn, plan usage, and a replay of the session.
-
A2: Across sessions
A dashboard, a journey view of how usage changed over time, and search across sessions.
-
A3: Jump from elsewhere
Other tools open a session directly by id, so a run report or the Cockpit can link straight to the session behind it.
A light index first, the heavy detail on demand
A Rust scanner walks the log folders, caches what it has parsed, and builds a light index of sessions; the full detail of one session loads only when I open it. That split came from a rebuild: the first version loaded everything, and on real volume the session list took 16.2 s. After the rebuild it takes 349 ms, and idle CPU dropped from 39.4% to 4.6%. One size target was missed, and the notes say so.
The code is written by AI agents under my specification, test contracts and review of the result.
Measured, with dates
Claude Code sessions, as of July 2026.
Faster after the rebuild (16.2 s to 349 ms).
The context tab, on synthetic data
Paused, on purpose
I set it aside in September 2026 to put my time into TarkOS. It works, but it isn’t in daily use, and I’d rather say that than dress it up. The plan is to restore and polish it, then publish it.